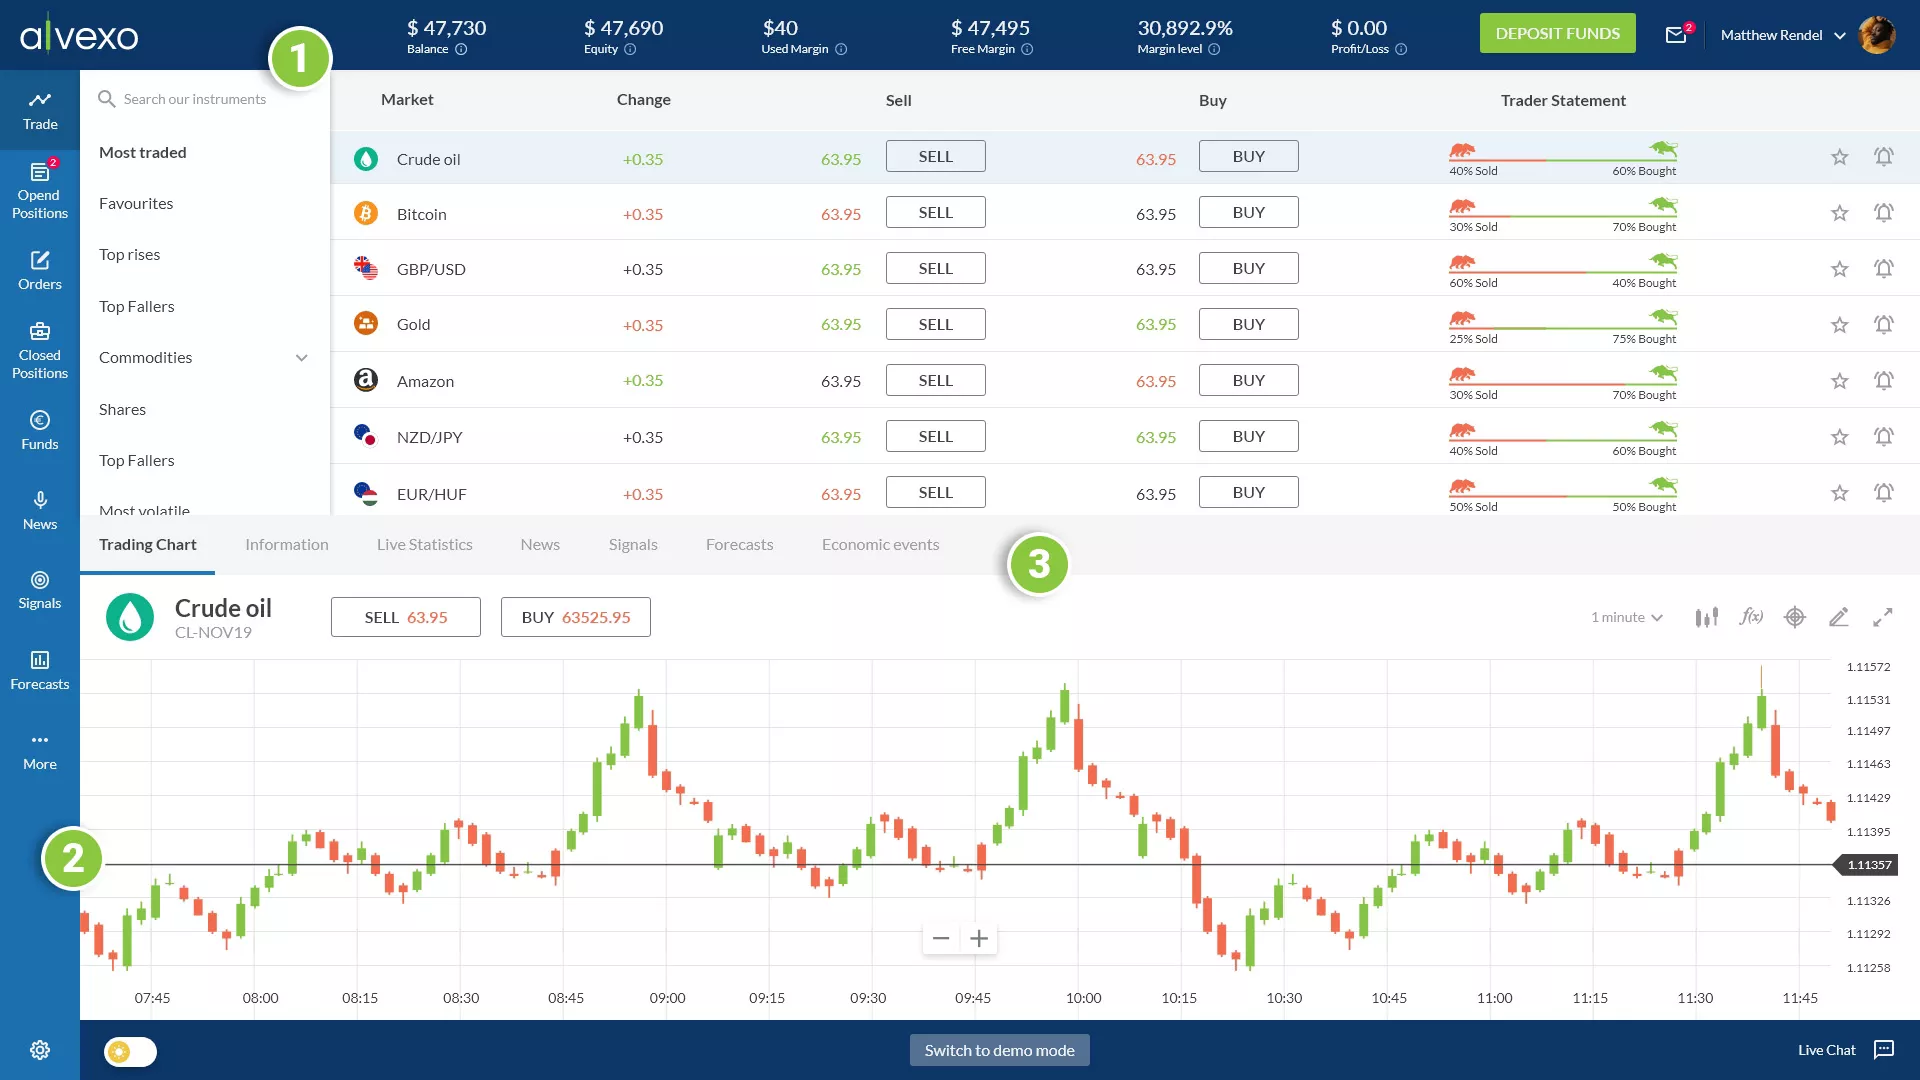
A browser-based platform for online CFD trading, the Desktop Trading Platform offers a comprehensive suite of tools and features designed to enhance the trading experience. This platform includes a live trading interface, advanced market analysis tools, an economic calendar, real-time news updates, and access to an online academy for educational resources.

Desktop Trading Platform
Main Trading Screen
Designed to accommodate a wide range of actions and services without requiring users to leave the screen. It features three primary menu areas:
Top Menu (1)
Displays balance status, a deposit button, and a user options popup menu in the right corner.
Side Menu (2)
Contains actions like positions and orders management, along with access to Alvexo’s content services such as financial news, trading signals, and webinars.
Middle Tab Menu (3)
Provides detailed information about the selected asset, including statistics, news feed, and forecasts.
Trading Signals
The trading signals section is located on the left side of the page and is divided into two main parts: the asset information and the detailed signal data. Trading signals serve as triggers for buying or selling an asset at specific price points, crafted by analysts who combine visual data with pre-defined platform fields.
Asset Information: Displays the selected asset, such as Crude Oil, with key metrics like entry price, target price (TP), and stop-loss (SL) values, along with the validity period and recommendation type (buy/sell).
Detailed Signal Data: Provides in-depth analysis, including preferences, alternative scenarios, comments on technical indicators (e.g., RSI, MACD), and key support and resistance levels.
Asset's Info
The asset information page provides statistics for specific assets, including price performance, trader sentiments, & daily buy/sell data. Key sections include:
Instrument Info: Leverage, lot size, spreads, pip value, swap rates, and trading hours.
Trader’s Sentiments: Percentage of traders buying and selling the asset.
Daily Low/High: Daily low and high prices.
Price Performance: Performance over various time periods.
Design Strategy
The design focuses on creating a user-centric, visually intuitive layout that highlights key data points clearly and consistently. Emphasizing data visualization and a clear hierarchy, the design ensures traders can quickly and easily interpret critical information, enhancing their trading experience.
Set Alerts
Traders can set alerts for specific assets to receive notifications when the asset hits a predetermined price point. This helps in making timely trading decisions without continuously monitoring the market.
Design Strategy
The trading alerts feature was designed for simplicity and efficiency. Users can easily set alerts by specifying the asset, target price, and notification preferences, ensuring they never miss critical market movements. The interface provides a clear and intuitive process for setting and managing alerts.


